Navigation: How Chart Exchanges Benefit the Cruising Community
Jon and Sue Hacking have been cruising for more than 40 years and have compiled an extensive library of charts that cover more than 30 countries in the Caribbean, Pacific and Indonesia. In this article, Jon explains their use of mbTiles and how creating a crowd-sourced chart exchange benefits the cruising community worldwide and contributes to the Karmic Circle that world cruisers tend to live by.
Published 9 months ago
Jon and Sue Hacking are well known in the cruising community and have been cruising on their Wauquiez Kronos 45 catamaran, Ocelot, for over 20 years. Over the years they have created a repository of chart files, along with Sherry and Dave McCampbell of SV Soggy Paws and and Bruce Balan and Alene D. Rice of SV Migration. This article is a follow-on to Sherry and Dave McCampbell’s report on using OpenCPN with satellite imagery.
Charting more than 30 countries
Ocelot’s mbTiles charts now cover the entire coastlines of most countries. We chart over 30 countries, including all of the Eastern Caribbean, Galapagos, Micronesia, Solomon Islands, PNG, most of tropical SE Asia and much of the tropical Indian Ocean.
We offer satellite imagery from ArcGIS, Bing (MSFT) and Google Earth, as well as nautical charts from CMap (new, not CM93) and Navionics. The satellite imagery is incredibly accurate, with max positional errors in the order of 3m (10’) and most of them can see underwater reefs to about 10m (33’). The resolution (Z18) is high enough to see individual coral heads and they’re exactly where plotted.
The nautical charts aren’t as accurate, of course, but they have depths, which are certainly useful. And we show you how to use “Chart Groups” in OpenCPN to switch between charts with only a single keystroke. Cruisers are welcome to download our mbTiles charts and we’re actively encouraging cruisers with high‑quality mbTiles to contribute them to our repository so others can download them.
Why are mbTiles superior?
MbTiles are a newer database-based format for storing map‑tiles. KAPs are limited to 128 separate colors, much like the old CompuServe GIFs. This turns out to be important when scrutinizing a coastline, looking for minute differences in the shade of blue that might show a good anchorage. MbTiles don’t have a color limit, so the color quality is much better.
KAPs are essentially a single picture, taken from whatever altitude you choose. For OpenCPN (our preferred navigation program) to display this image at a different altitude (zoom level) it has to decide which pixels to display and which to throw out. This can put a huge strain on its display engine, especially when panning around with many KAPs displayed. So much so that we’d typically have to switch to our CM93 charts when we wanted to pan to somewhere else, and then switch back to our KAPs only when we’re over our new area of interest.
MbTiles, on the other hand, can have multiple zoom levels stored in the single file. This makes it easy for OpenCPN, as all it has to do is extract the correct zoom level from the mbTile file and slam it out to the display engine. We find panning with mbTiles displayed is slightly slower than with, say, CM93 charts, but not badly so, and performance is quite good when moving around with mbTiles displayed.
Also, OpenCPN has a concept of “Chart Groups.” Our mbTiles are typically made from ArcGIS, Bing (MSFT) and Google Earth satellite imagery, as well as nautical charts from CMap and Navionics, each in its own mbTiles file.
By putting each chart type into its own chart‑group, a user can switch between charts with only a single keystroke. So in 2‑3 seconds, I can flip through all five of my charts, to see which one is the best for my situation AT THAT INSTANT. Very cool.
Back when we were using KAPs, we only made them from Google Earth imagery, as this was the only imagery that was easily available at the time. Now we find that Google is usually the worst of the three types of satellite imagery we use, so the quality of our imagery has improved as well.
Sharing files benefits everyone
We decided to start sharing our files after an incident in 2015. We’d joined the Sail Indonesia rally in Kupang, in the SW corner of the island of Timor, just north of Australia. We’d had some mechanical issues which had delayed us, and by the time we’d replaced both head gaskets, only two other rally boats were left in Kupang (they’d had mechanical issues as well), a trawler and a big monohull. So we set off together. I’d given my KAPs to the trawler, but then their computer had died, and they refused my offer to fix it. I also hadn’t realized just how new they were to cruising.
On our third day, we were supposed to go up Bolling (Boiling) Strait, between Lomblen and Adunara Islands, but the trawler had another mechanical issue and had to turn back. The monohull went with them, as we were already in the current of the channel, which was running at 4 knots. The trawler’s AIS wasn’t working, so we could only track the monohull. The next day, as they were approaching what they thought was the channel we’d taken to our anchorage off the NE corner of Adunara, the trawler depended too much on their Navionics charts and went aground on a falling tide.
Their Navionics charts were only off by 150m, which is pretty normal for commercial charts in SE Asia, but the channel is 200m wide, so they’d missed the it by 50m. When the tide went out, they leaned over and must have sprung a plank, because by the time we came down to help them off, at 9pm that night, they were still hard over and their engine room was full of water (they hadn’t called for help, so we hadn’t brought our big crash‑pump). In the end, all we could do was to take them up to the other boats, and then come down the next morning to strip their boat.
I don’t want to have to do that again, ever. Many people have helped us over the course of our 28 years of liveaboard cruising. We’ve helped others when we can and sharing these charts is one of those ways. We love contributing to the Karmic Circle that world cruisers tend to live by.
Using tools to make charts
We use several tools to make these charts. They’re all freely available on the web, as is the data itself, but it does take a lot of time and especially disk‑space and internet bandwidth. I also publish a How‑To page for making mbTiles for those who’d rather make their own, or if they want charts for areas we don’t cover.
First, we create high‑level charts of our area of interest (typically a whole country), so we know where the coast, reefs and islands really are. Then we create routes in OpenCPN along the edges of land, or around archipelagoes of reefs or islands. When all of our routes are checked and finished, we export them from OpenCPN as GPX files.
Then we feed them to a program called Sat2Chart (ex‑GE2KAP), written and maintained by Canadian Paul Higgins. Sat2Chart is our automation engine that drives the SAS Planet program that gives us access to all the imagery that we use. It first downloads all of the information (tiles) that we want into the SAS cache, then it uses that info to create the mbTiles for OpenCPN. But that process of downloading the data can take days, during which time the computer is unavailable for any other use. And I add some special tweaks at the end, to create my final mbTiles.
How the cruising community benefits
I don’t want to violate anyone’s privacy by revealing contact info, but we’ve received several messages of thanks, by email, or on social media (usually FB or Cruiser’s Forum). Usually they’re only short “thanks for providing these to other cruisers” or “thanks for all the effort you’ve put in” kinds of messages.
We also invite (but certainly don’t require) folks to contribute if they want, which is an even bigger show of appreciation. In the first half of this year we’ve received almost 20 donations, from $5 to $100 and totaling over $500. This certainly helps towards our hosting fees, as it costs us extra to host and to download these huge files (up to 6GB each and we currently publish over 250 collections). Just today we received a $10 donation accompanied by the comment:
“Your Thailand/Indonesia mbtiles are brilliant. Thanks so much for making these available.
Doug & Jen on SV Haruki
However, I want to emphasize that we do not require donations. We’re much more interested in getting these charts into as many cruiser’s hands as possible, to give them more and better tools and to make their cruising safer and more fun. The donations are really for those who can, to show us their appreciation.
Commercial charts and mbTiles differences
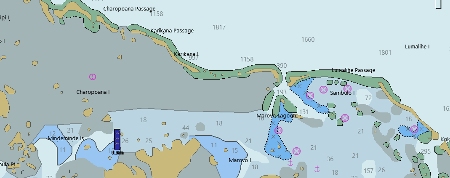
The Navionics chart for the Morovo Lagoon in the Solomon Islands looks like this.
Compare it to the satellite image:
There are some depths in there, but you can see that the whole northern section is uncharted. Even worse, the chart is slightly offset. This is common with commercial charts, but it means that you need to use them only when you have good visibility and you can’t really depend on them, as the reefs aren’t quite where they’re shown.
The CM93 image of this same area is completely hopeless:
Not only is it somewhat offset, but it has essentially no detail at all. Yet this was all we and most other cruisers had for much of our cruising, from 2003 through 2012, from Panama, through Ecuador, the Galapagos, the Marquesas, Tuamotus, Society Islands of French Polynesia, Tonga, Fiji, Indonesia, Malaysia, Thailand, Sri Lanka, Maldives, Chagos, Seychelles, Madagascar, Mozambique and South Africa. We were much more cautious then (we had to be) but I’m still amazed that we didn’t end up having more arguments with reefs.
Cruising in remote places
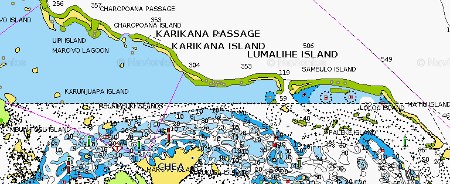
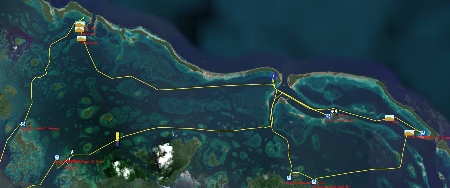
Probably the best example is when we were cruising through Morovo Lagoon in the Solomon Islands, with Dave and Sherry McCampbell from SV Soggy Paws, in 2019.
This is a screenshot from OpenCPN. The yellow lines are our tracks and the small graphics that look like a hump of sand are my annotations of shallows, where we had to go over reefs, with depths marked next to them in red. This image is from the Charts area of our Solomon Islands cruising info page.
As you can see, the whole lagoon is shot through with reefs, yet both boats were able to navigate through this maze with ease. When blown up, the imagery is good enough to pick places (passes) where our boats would be able to go over the reefs. In fact, since we’ve been using satellite imagery to augment our charts since 2014 and we now know how perfectly geo‑referenced they are, if I had to, I could have navigated through here on a moonless night, with perfect confidence that I knew exactly where we were relative to the many reefs. I certainly wouldn’t want to and I wouldn’t expect others to trust the accuracy of these charts until they’d used them for a while, but the max errors we’ve found are only on the order of 10 feet or 3 meters. Absolutely amazing geo‑location. It’s probably more accurate than our WAAS‑compliant GPS.
We also publish our tracks as GPX files, with descriptions of the anchorages and our chart annotations (shallows, etc) for other cruisers to download. GPX is a form of XML, so human readable and is becoming the standard for this sort of thing. Some of our tracks are also in PTF format, for MaxSea users, but most cruisers are now using OpenCPN instead.
Chart Contributions Welcome
I actively encourage cruisers with high‑quality mbTiles to contribute them to our repository so others can download them. I mention this on our download page (and some other places, when I can). But I’ve had no real bites, probably because folks who get to our website are looking to download our mbTiles, not to provide them. Not sure what to do about this, but I’d love some ideas.
I’d like to create a single place where cruisers can go to download whatever charts they’d like and I’m willing to host that if necessary. And I’ve created our Download page in such a way that others can include the essential download part of it in an iFrame pretty easily. But most of the mbTiles I see out there don’t really have the quality or resolution that I like to put into my charts. Because of that, they’re usually smaller than my mbTiles, & that has a certain value, but disk‑drives are pretty cheap these days, & I’d rather have higher quality, higher resolution charts than to save a bit of disk space, especially when I’m approaching an area of difficult shallows.
Thinking about this, when I get back to my dev‑computer, I’ll probably add links to the other three to four pages I know of (Bruce Balan’s Chart locker, Soggy Paws, etc) that also offer mbTiles for cruisers to download. I’ve been resisting this, in the hopes of consolidating the pages, but if that’s not going to happen, then the best I can do is to show cruisers where else they can download charts.
Meeting Bruce and Alene from Chart Locker
Bruce and Alene are good friends and I think this sort of crowd‑sourced chart exchange is extremely useful for the cruising community. It takes a lot of time and effort (and internet bandwidth) to make these charts, so it makes sense to circulate them to other cruisers.
We were both doing major refits on our boats in Phuket, from 2012‑14, and we were both having major problems with the contractors doing the work. So spending lovely weekends visiting them in their beautiful apartment and discussing our refit issues was a wonderful relief after a week of extremely hard work for both of us. Bruce would provide a fabulous dinner on Saturday and we’d provide Lox, bagels, cream‑cheese and Mimosas for Sunday morning.
We both wanted to create a repository where cruisers could upload charts, as well as provide charts for others to download. Bruce even rented some space on MediaFire, to store the charts for download. But we each had our own way that we wanted it done.
We also have somewhat different philosophies on the creation of mbTiles. Bruce (as well as Sherry and Dave McCampbell of Soggy Paws) examine where they want to go and then they make detailed mbTiles of those places, with only a few zoom‑levels included, as that saves both time and disk space.
We don’t necessarily know where we’re going to go and we certainly don’t know where other cruisers want to go. And having used these charts for so long, we’ve come to depend on them and it’s extremely important to us that we not get into a situation where we want a chart but don’t have one.
So we take a shotgun approach, creating charts for the entire coastlines of the countries we chart. We also provide all zoom levels from Z10 to Z18 (each zoom level is twice as close, so 4x the amount of data) to improve the performance of OpenCPN. Our approach certainly creates much bigger mbTiles, which can be a problem to download &/or store, & can strain OpenCPN’s display engine on slower computers, but technology is making all of that less of a problem now.
How the cruising community benefits
Obviously, the more high‑quality charts that the cruising community can use, the safer their navigation should be, especially when we’re out in the boonies, where commercial charts are typically very low resolution and often offset from reality. Our charts, derived (mostly) from satellite imagery, are truly amazing, with max positional errors on the order of only 10’, or 3m. This is at least an order of magnitude better than the commercial charts we’ve been using, especially when we get away from population centers.
More accurate charts should lead to safer navigation. Our satellite imagery also shows reefs and such, as it can usually see into the water to a depth of about 30’ or 10m. Seeing exactly where the reefs are leads to fewer boats running into those reefs and seeing exactly where the passes are through the reefs can lead to more fun. The ability to actually SEE the bottom means that you can avoid coral and can often anchor in nice sand patches (although we can’t tell much about dark bottoms like mud).
Jon and Sue Hacking
SV Ocelot
………………………………
About Jon and Sue Hacking
After land-touring South American in a van, Jon and Sue are hoping to get back to Ocelot (now on the hard in northern Borneo) in August 2023, so they can join the Passage to the East rally that goes over the top of Borneo, then continue over the top of Sulawesi (Indonesia) to do some diving in Raja Ampat. Then, in early 2024, they are planning to sail south to one of their favorite dive destinations, Triton Bay, to do some more diving. In May, when the SE trades return and make the water murky, they’ll start making their way west through Indonesia.
Their website (which is not a blog!) contains over 1,000 pages, including a growing section on Cruising Information.
Cruising the World on SV Ocelot
Related Links:
………………………………
The opinions expressed in this article are the author’s own and do not reflect the view of Noonsite.com or World Cruising.
………………………………
Find out all news, reports, links and comments posted on Noonsite, plus cruising information from around the world, by subscribing to our FREE monthly newsletter. Go to https://www.noonsite.com/newsletter/.
Related to the following Cruising Resources: Apps, Caribbean Sea, Charts, Circumnavigation, Circumnavigation, Cruising Information, Malay Archipelago, Navigation, Pacific Crossing, Routing, Timor Sea
Comments