This article was first published in the SSCA March 2023 Cruisers’ Bulletin and is reproduced here by kind permission of the authors and the Seven Seas Cruising Association.
Commercial Charting Accuracy in Less Popular Cruising Areas
For those of you that have plans to go cruising overseas (including the Caribbean) in your future, this is a very important subject. Based on our 20 years’ experience cruising overseas in the Caribbean, across the Pacific and all over SE Asia, we know that commercial charting accuracy away from the US, Europe, Australia and New Zealand is not nearly as accurate and detailed as it is in the US.
Use of a chart plotter with commercial charts that you pay lots of money for, is fraught with danger if like many cruisers you use it exclusively to cruise in relatively remote areas. The main problem is that commercial charts such as Navionics, Garmin, Raymarine, CMap, etc, though loaded with navigation information, are sometimes reasonably accurate and sometimes not.
The problem is that you NEVER KNOW. And the shoreline detail and nearshore depth indications often leave a lot to be desired.
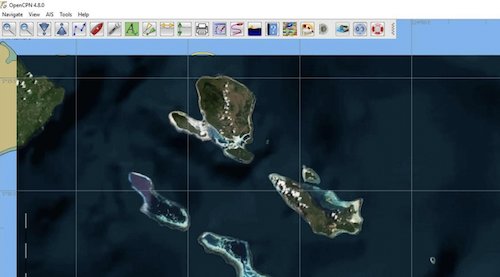
Using satellite imagery for close-in navigation with OpenCPN
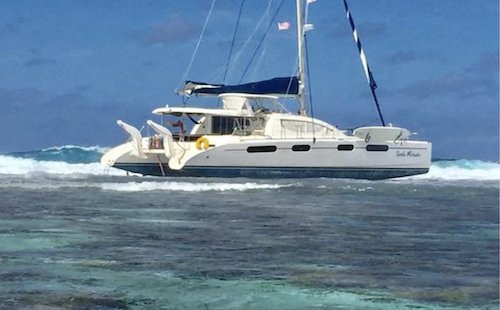
Cruisers are still running aground out here, some losing their boats when just using commercial charting.
Recognizing this, much work has already been done by the overseas cruising community, at least in the Pacific and Indian Oceans. The major players we are aware of are all SSCA members. Many of us out here have been using satellite imagery for our close-in navigation charting with OpenCPN for at least 10 years. The advantages of doing this over using even up-to-date commercial charting are many, including little expense, greatly improved accuracy and shoreline detail, and the ability to trade imagery, waypoints and tracks with other OpenCPN users.
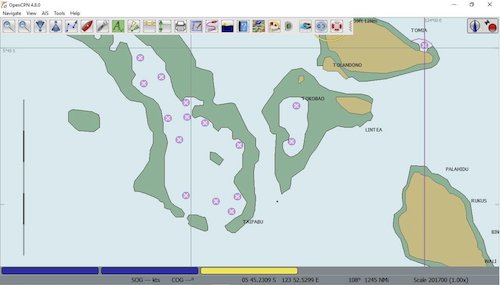
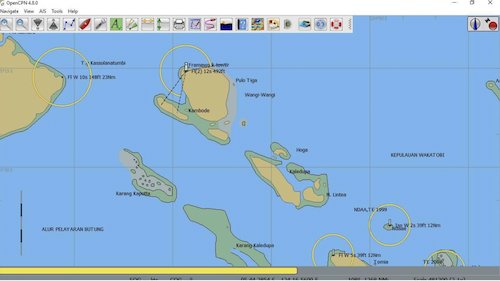
Would you prefer to use this commercial chart…
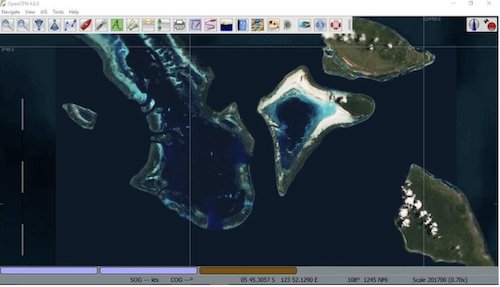
Or this satellite chart?
Several cruisers including Terry Sargent on Valhalla, Sherry McCampbell on Soggy Paws, Jon Hacking on Ocelot, Bruce Balan on Migration, and Mike on Zen Again, maintain large collections of satellite charts that are shared with other cruisers. The image collections number in the thousands, covering from the Eastern Pacific through the Indian Ocean, plus the Atlantic Ocean and the Caribbean, and are continually being enlarged. Tracks in and out of many of these anchorages are also available.
These five cruisers also maintain huge collections of anchorages in the same areas with information details included.
All this has been made possible by Paul Higgins, who years ago developed a program called GE2Kap. GE2KAP has now been replaced by Sat2Chart, and has many more options for converting a satellite image to a navigation chart. Now there are also multiple sources for other satellite imagery besides just Google Earth images. So a cruiser can now choose from multiple images if there are clouds or sun reflections degrading the desired image.
Also, these cruisers have produced detailed instructional information, including multiple articles and slide show presentations describing the importance of satellite charting for safe/fun off-grid cruising and how to make the charts.
Accurate and Safe Routing
We do have a small chart plotter aboard. We like its user-friendliness and also the ability to see the bottom profile and type with its included depth sonar. But because of the accuracy and shoreline detail problems with commercial charts in lesser-traveled areas, we rely on it mainly offshore. Typically we lay our track using OpenCPN on the navigation station computer. This computer is populated with anchorage waypoints and other cruisers’ tracks, as well as both conventional and satellite charts. Once we are happy with the planned route, we then export the planned route as a gpx file to our Garmin 526s chart plotter at the helm station.
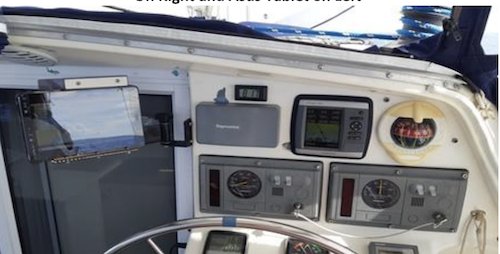
This gives us an accurate and safe route to follow, including an accurate depth profile, right at the helm with our weather-proof chart plotter. And we don’t have to worry about the accuracy of its charts. Also, in tight nearshore situations, we make sure that we have the satellite imagery with others’ tracks, our planned route and possible alternative anchor spots on OpenCPN running on our Asus tablet. This is also mounted at the helm station, so that we don’t need to leave the helm to see the accurate satellite chart on the computer. This tablet also has an up-to-date copy of Navionics charts for additional reference as well.
Most commercial charting is probably based on various government data that suffers from historical and datum inaccuracies. Out here in SE Asia, we are all in the habit of warning new cruisers coming into the area to wean themselves off using only their fancy chart plotters, and learn to use OpenCPN with satellite imagery as an important supplement to whatever charting system they are using.
Most Americans, and most other first-world cruisers, are used to accurate charting with monthly updates in their home countries, so are not aware of the danger overseas.
Sample Charts From the Soggy Paws Website
As an example of what is available, in this article we have included a partial list of satellite charts we have made for our upcoming trip through the Red Sea. These have been uploaded to our website “SatCharts” page for anyone to download.
There are many more listed for areas of Southeast Asia and the western Pacific. We have not uploaded our full collection because Terry on Valhalla has been the de facto librarian of waypoints and satellite charts in our region. Be sure to read all the cautions and ‘how to’s’ on our website. In general, charts made before 2020 are KAP files, those 2020 and newer are mbtiles. Mbtiles format provides greater color variation, and therefore much better detail at low level.
Note: You must be using OpenCPN v5.0 or above to use mbtiles format charts AND have OpenGL enabled. mbtiles format allows for better satellite chart details than KAP charts.
Links to other Satellite Chart Sets
Below are links to other cruisers’ satellite chart sets.
- Migration’s ChartLocker: Pacific Mexico, all the Pacific Islands – mbtiles 2021/2022; new (2023) satellite imagery marine charts for the Dominican Republic. While they are MB Tiles, when used appropriately, they fill in many areas/harbors with both land and water detail.
- Ocelot’s mbtiles Charts: SE Asia, Western Pacific, and Indian Ocean 2021/2022
- Zen Again’s Charts: Pacific Ocean, SE Asia, Crossing to S Africa, S Atlantic, Brazil
- Valhalla’s Charts (Terry’s Topics): SE Asia, Indian Ocean, and Western Pacific And CM93 v2 Download for OpenCPN. Downloadable anchorage waypoints in GPX format. Mbtiles
- Jacaranda’s Charts: French Polynesia
- Soggy Paws’ Charts: Red Sea (Complete), Philippines (Partial), Papua New Guinea, Solomon Islands, Micronesia, Marshall Islands, Fiji, French Polynesia
This link takes you to the Soggy Paws website with additional detail on installing the charts:
Cautions About Satellite Charts
DISCLAIMER: Satellite charts made using Sat2Chart are homemade charts taken from Google Earth and other satellite imagery (Bing from Microsoft, ArcGIS from ESRI, Yandex from Russia, etc.). Don’t trust your boat to these charts without other corroborating evidence (your own eyes, other charts, depth sounders, etc).
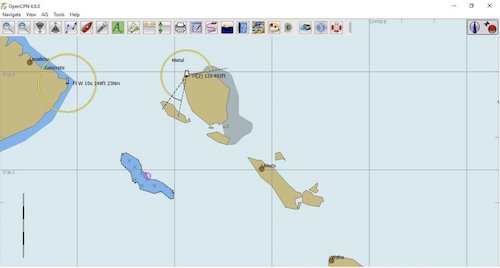
Disappearing reef 1, satellite chart
Disappearing reef 2, commercial chart
Disappearing reef 3, commercial chart
Satellite imagery chart pictures are in general VERY accurate. They are much more accurate and reliable than even the latest available commercial charts we have in the Western Pacific island countries and much of SE Asia. They contain substantially more detail, especially once you learn how to read the depth colors on a satellite chart.
However, we know of a few issues possible with these ‘home-made’ charts:
1. Always cross reference with known waypoints before you trust any home-made charts. And always back up this new technology with ‘Mark I Eyeballs.’
2. Always review multiple satellite chart sources and try to pick the best one for the area you are planning to traverse.
- Sometimes satellite pictures have poor images due to low sun angle or clouds.
- Very occasionally satellite images from Google Earth (GE) may have remote reefs ‘missing’ or painted out. We are not sure why this is, but don’t assume an empty fuzzy expanse on a satellite image is really empty. For example try to find S Minerva Reef, Rose Atoll, and Fonua One One (Tonga, S Vavau Group) on a GE chart. If in doubt, it is worthwhile to cross reference satellite charts with a commercial chart.
- If you are using GE imagery, and the chart has clouds in it, is “painted out” or lacks the normal GE detail, it’s worth taking a minute to check the additional historical images available. GE continually updates its imagery, so there are often many other older images to choose from.
- We no longer use GE as an imagery source, but instead are using SAS.Planet. SAS.Planet makes it easy to quick-check imagery from several sources, including Google.
The best download source for a known stable version of SAS.Planet, configured to work well with Sat2Chart is Paul Higgins’ (the GE2KAP/Sat2Chart developer) download folder here;
https://www.gdayii.ca/Downloads/
Download the SASPlanet.zip file, unzip it and put the unzipped folder on your C: drive (no “installer” needed). Make a shortcut to SAS.Planet.exe and put that on your Desktop or Start menu.
3. In areas with small patch reefs, we have noticed that sometimes clouds form right over the reefs and small islands. You might think “Oh, that’s just a cloud”, but there’s a possibility of something solid underneath that cloud. The reef warms the water and causes the small cloud, which obscures the reef in the image. Always be suspicious of clouds on satellite imagery as you can’t see underneath.
About GE2KAP/Sat2Chart
Most of these cruiser-made charts were made with Sat2Chart (formerly known as GE2KAP), a free utility available on the internet. The developer, Paul Higgins, continues to put hundreds of hours per year into development and expansion of this tool. His website is here:
http://www.gdayii.ca/index.php
If you think satellite charts are useful to you, a small donation to Paul is suggested.
Working with Multiple Chart Sources in OpenCPN
Once you have installed the charts for use by OpenCPN, make sure you have “show chart outlines” display option turned on. (Shortcut: type “o” on the keyboard toggles to show and hide chart outlines). You should then see red chart outlines for the areas of charts you have added.
You should also see Blue, Pink, and Yellow/Brown bubble/bars at the bottom of the Chart area. These will change as you move the chart around and zoom in and out. These designate the available charts. The left-most bubble represents the most detailed chart available, scale-wise. The right-most bubble is usually the CM93 world-wide chart.
If you have ‘chart quilting’ turned on in OpenCPN, play with the light blue bars (KAP files) and pink bars (mbtiles) at the bottom of the screen to see which level of chart you can choose. The left-most bars on the bottom of the chart table are the most detailed charts, and the right-most are the least detailed.
The easiest way to zoom in and out is with the + and – keys on your keyboard, or your mouse wheel.
See the sample OpenCPN CM93 chart on Soggy Paws website for a display example of some of the information above.
http://svsoggypaws.com/images/opencpn/opencpnquickstart.jpg
OpenCPN has excellent help files, and there is an OpenCPN User group on Facebook, as well as a support forum on CruisersForum.com.
Added benefits of OpenCPN include the following very useful Plugin applications:
- Climatology consisting of wind rose or wind barb display Pilot Charts with wind, current and tropical storm tracks averaged since the 1980s and overlaid on your chart.
- Radar Overlay for Garmin & Navico digital radars
- Weather Routing looks at historical weather and current data to help you plan a future voyage
- Polar file creates one for your boat from known boat polars or your own custom polar
- Voyage Data Recorder records and displays boat data from onboard sensors
- Stowage Manager allows a cruiser to create an onboard stowage file by location
- Logbook function lets you digitize your official daily logbook
- NMEA Instrument displays your course, speed, wind, depth, etc.
A Real Game-Changer
For those of us in SE Asia that have been involved developing and pushing this issue for some time, we are glad it is finally being recognized for its importance. Satellite imagery used for navigation with OpenCPN is a real game changer for those cruising overseas. Had we not been using this in our remote cruising over the past about 10 years we would have been aground long ago.
Dave and Sherry McCampbell
SV Soggy Paws
2005 St Francis 44 MKII Catamaran, Draft 3.5 ft
Homeport: Melbourne, FL USA
SSCA members since January 1992
………………………………
About the Authors:
Dave McCampbell is a retired US Naval Diving and Salvage officer with over 40 years cruising and eight sailboats-worth of maintenance experience. Sherry is a retired computer programmer and is currently the navigator on their St Francis 44 catamaran, s/v Soggy Paws. The McCampbells have voyaged nearly 40,000 miles from their home in Florida and are currently cruising in SE Asia. Their blog is an incredible resource for cruising sailors.

The opinions expressed in this article are the author’s own and do not reflect the view of Noonsite.com or World Cruising.
………………………………
![]()
About the Seven Seas Cruising Association™!
The Seven Seas Cruising Association™ is one of the oldest and largest worldwide organizations supporting the cruising lifestyle for coastal, near/offshore boaters. SSCA supports members wherever they travel, for weekend, short and long-term cruising. Founded in 1952, today’s SSCA remains true to the traditions of its original members—sharing cruising information, fostering fellowship, and leaving a clean wake. Cruisers Helping Cruisers.
………………………
Find out all news, reports, links and comments posted on Noonsite, plus cruising information from around the world, by subscribing to our FREE monthly newsletter. Go to https://www.noonsite.com/newsletter/.
Leave a comment
You must Login or Register to submit comments.
Awesome resources and advice. Also, If you are on Mac you can use qgis instead of sat2chart to make motives. See sailing Aquarius on YouTube for an excellent tutorial.